
Census-ational
Census-ational
How to access the ultimate American dataset.
Every ten years, the nonpartisan Census Bureau sets out to count every person living in America. It’s an astounding amount of data that provides important information about our country and communities, capturing demographic information from age to occupation. And the best part? The data is free, public, and easy to access.
While we’ll have to wait a few months for the Bureau to finish collecting responses for the 2020 Census (and a few more months after that for the data to be released), we can view past data and estimates for current populations at Census.gov.
There are a lot of different ways to slice and dice this data, and there are a lot of existing reports on the website (for one, look how much we’ve grown!)—but this post will show you how to view and download raw Census data.
This is a foundational data source for students, political scientists, businesses, and others—but on a personal level, it’s immensely helpful to better understand your community.
How to access Census data
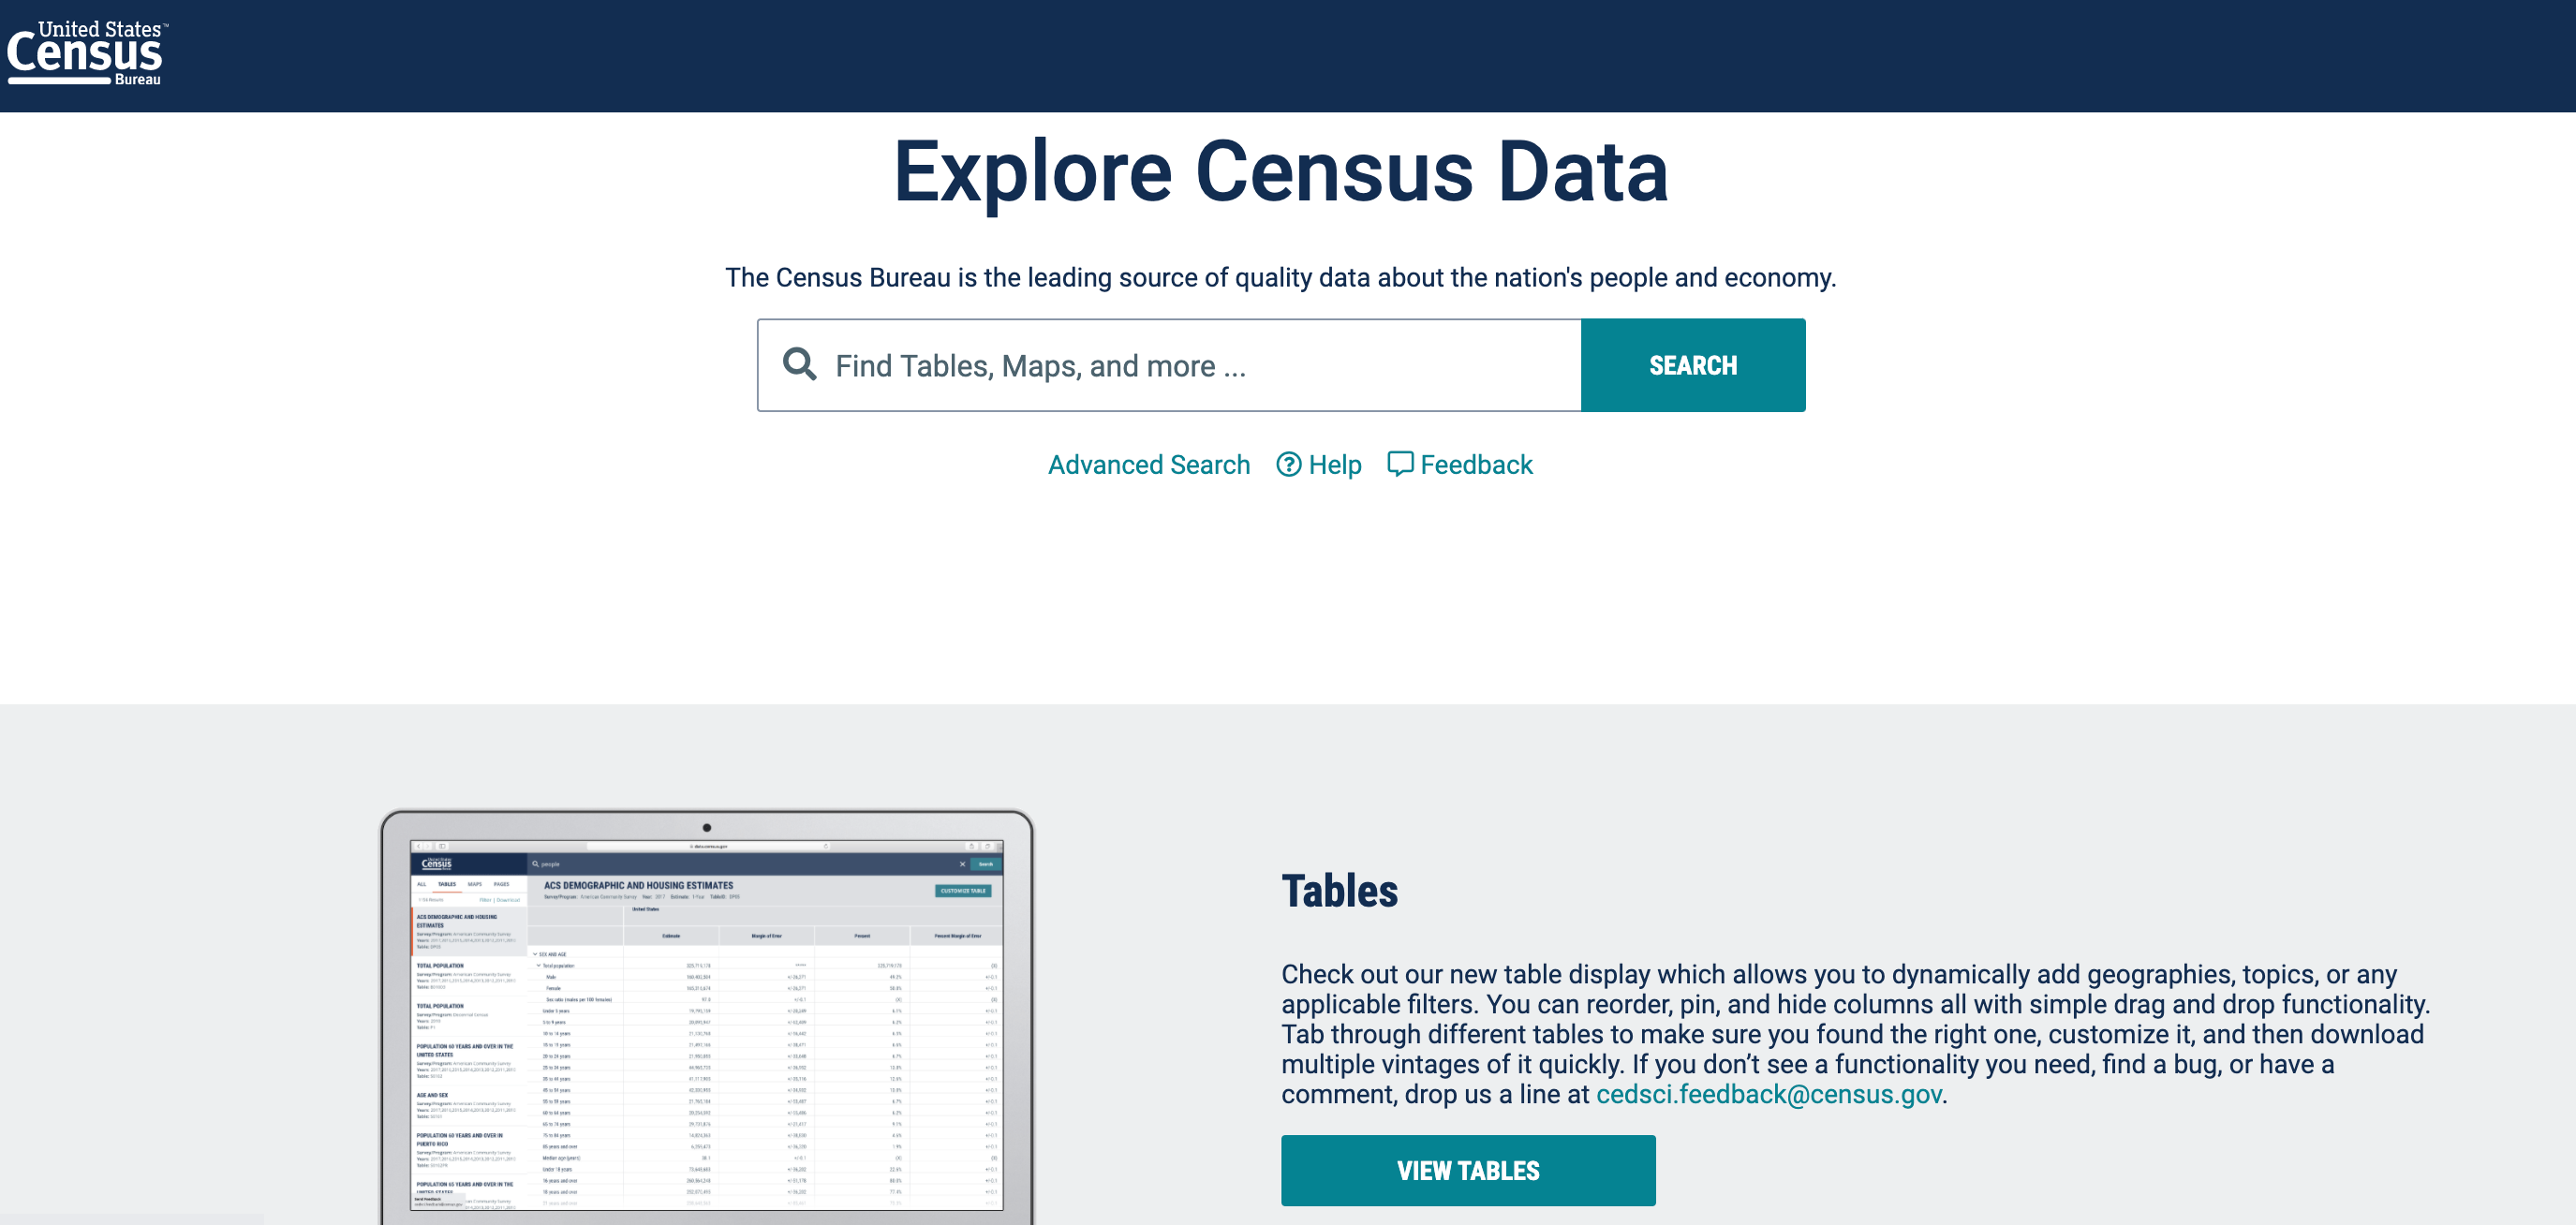
To start, head to the data page for the Census Bureau: data.census.gov. This website works best in Chrome and Firefox. The page should look like this:
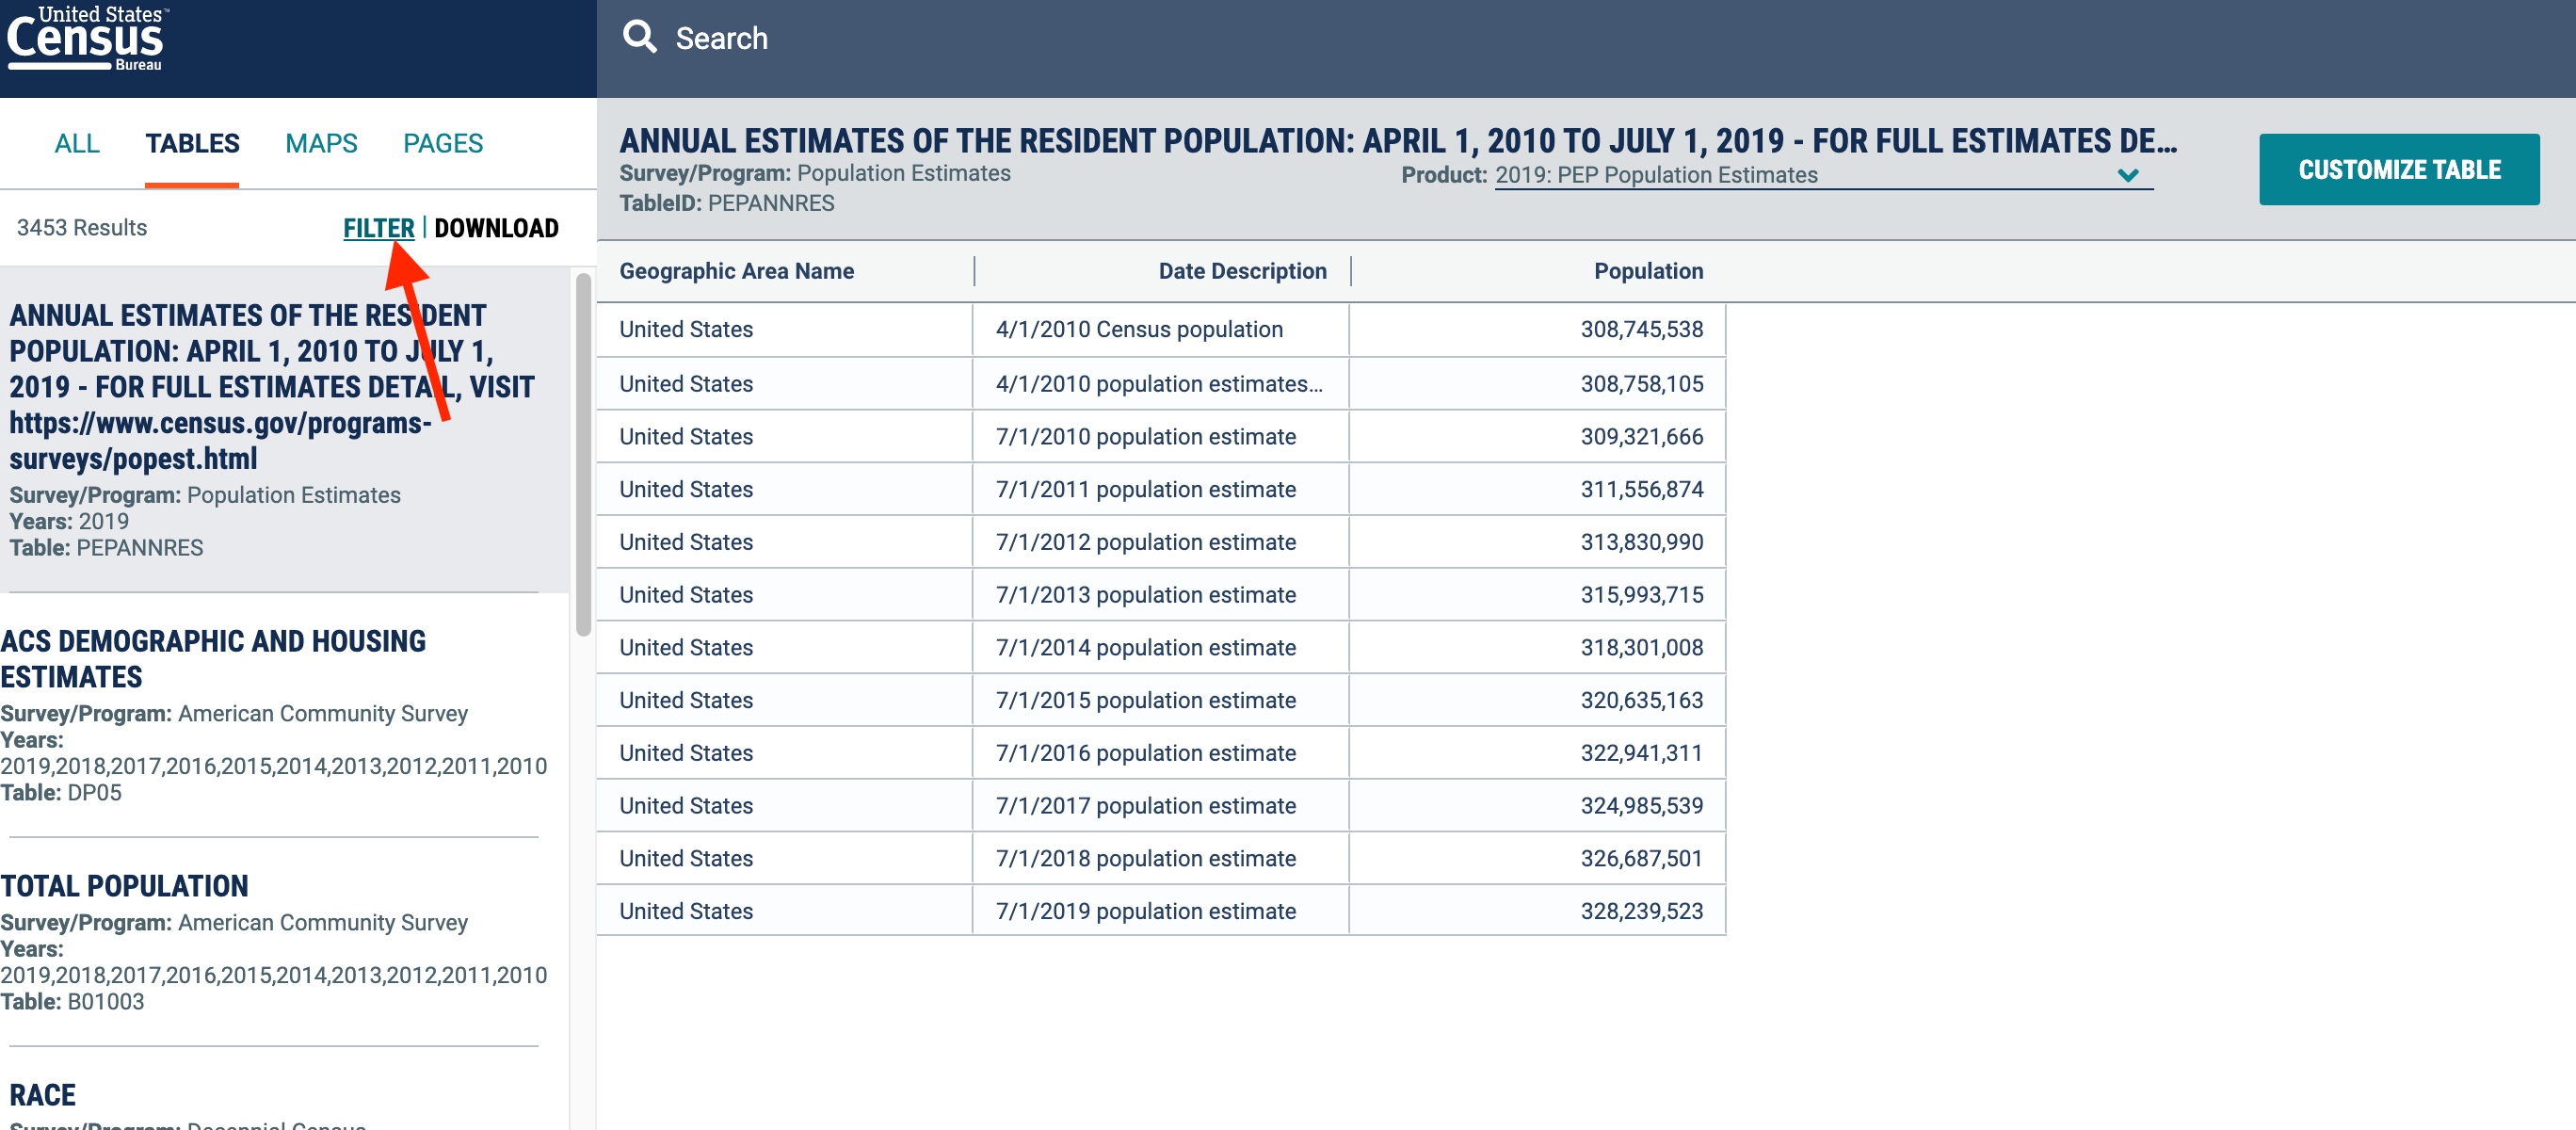
Scroll down and click “View Tables.” The landing page shows the most recently added national data. To customize a table based on the geography, year, or demographic you’re interested in, click “Filter” on the left hand side of the screen.
This will open a screen to build your dataset. On the left are filters. Geography = state, congressional district, school district, county-level data, etc. Topics = demographic selection like race, occupations, housing types, etc.
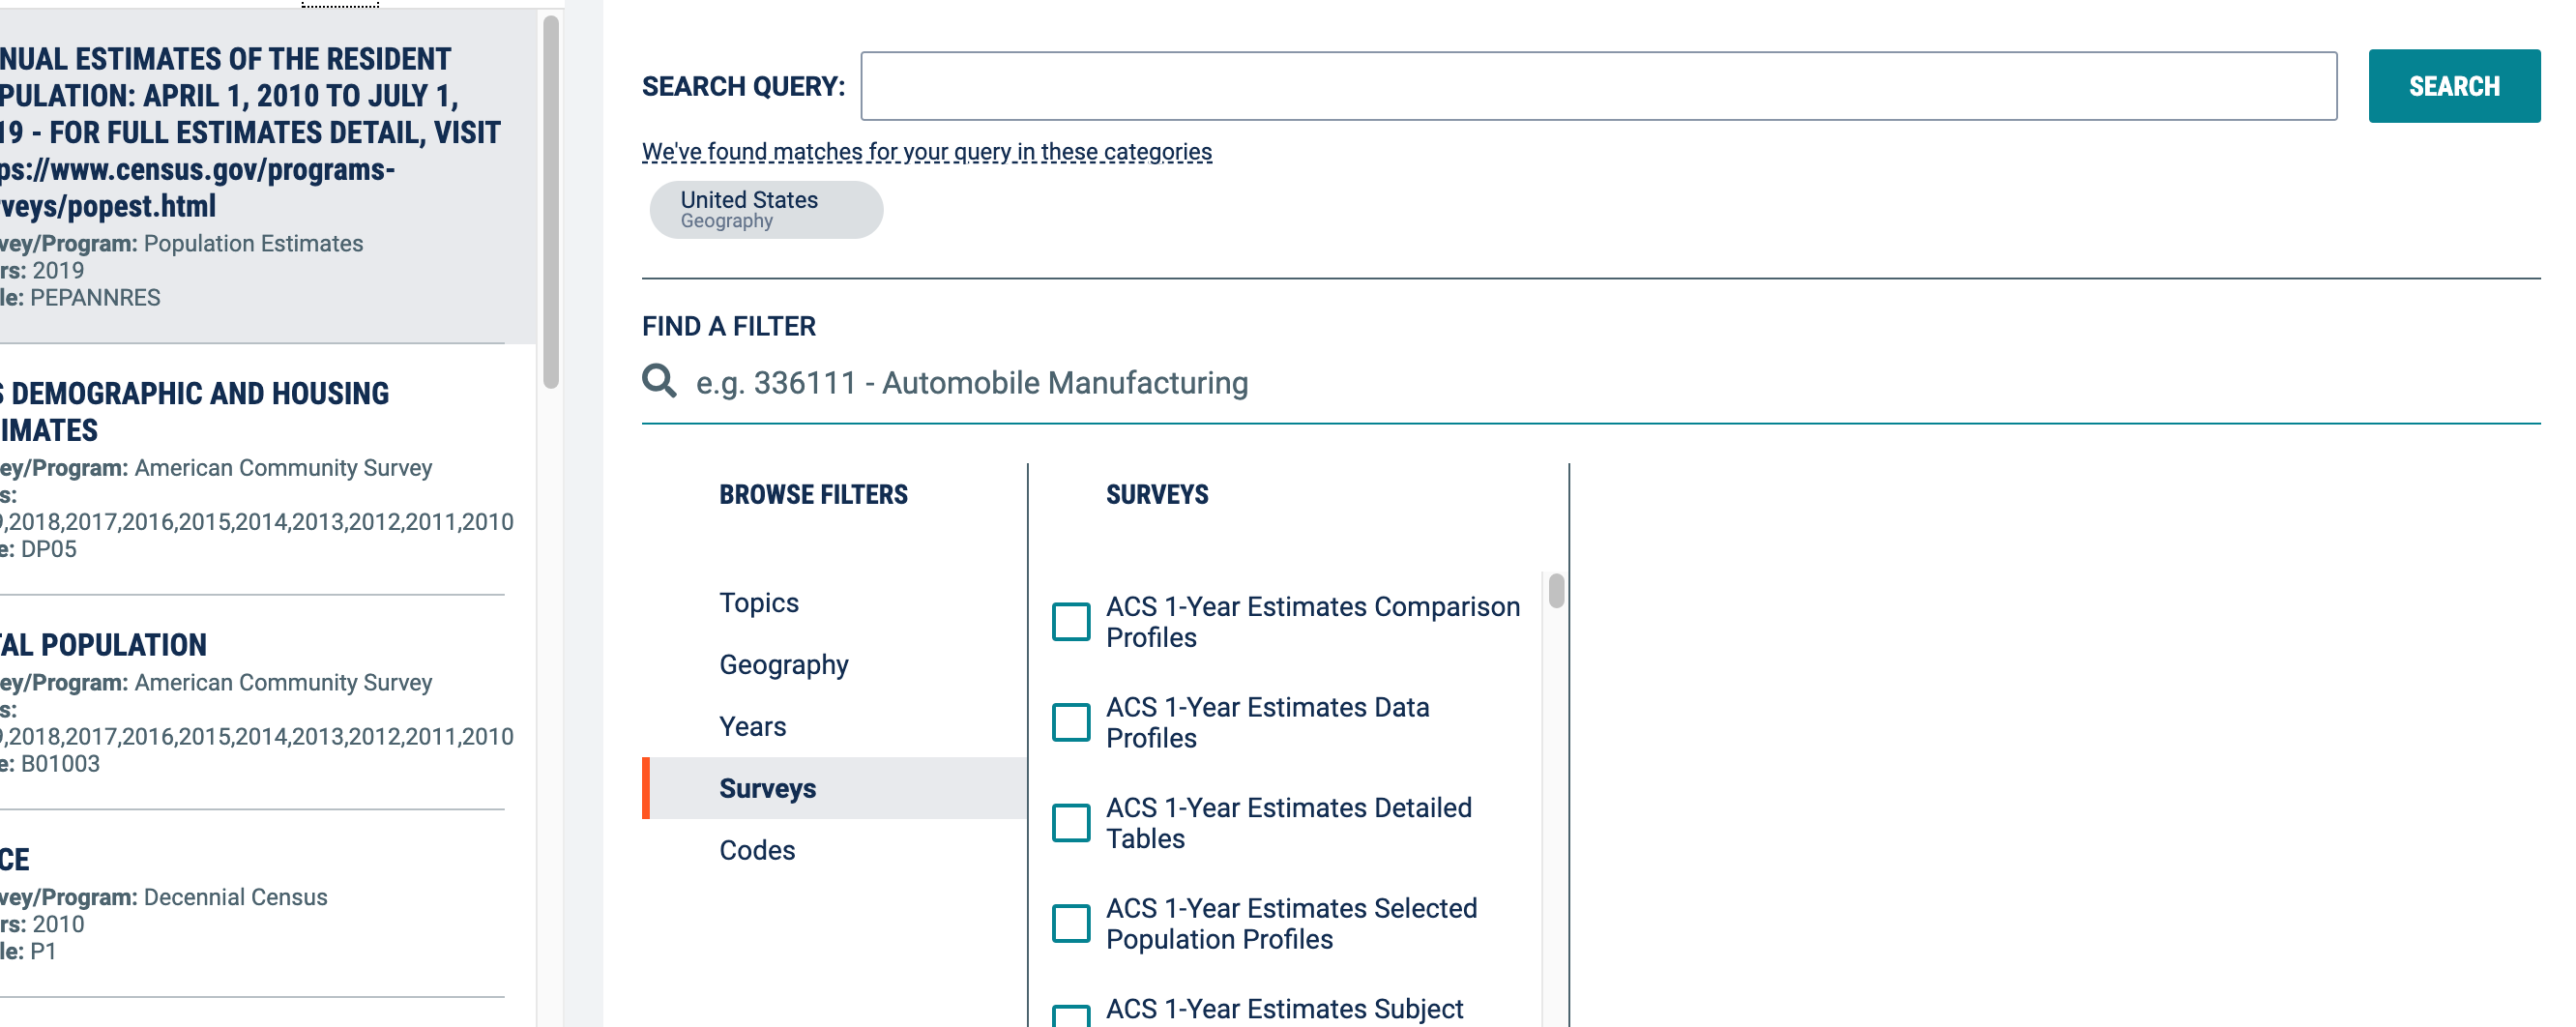
Surveys available to select will vary by the topics, years, and geographies you select. Not every combination will have a Census dataset ready to download, so play around with it. Unusual combinations will still lead you to high-quality survey data or projections based on existing Census data.
Click here for a refresher on survey data and how to calculate the margin of error.
As always, let’s use the county I grew up in as an example—Travis County, Texas. I’m interested in county-level data (geography), age and sex and family living arrangements (topics). I want to use Census data, so I scroll down and select “DEC” files (Decennial Census). Here’s how I filter the data:
After minimizing the filter screen, the page shows my new dataset! It compares my selected Travis County, Texas data with the U. S. population.
Click “Customize Table” to download and further edit the dataset. I also recommend transposing the data, so that the variables (demographic information) are along the top row, and the geographies (in this case, U. S. population vs. Travis County population) are listed vertically, as their own entries.
Then, it’s pretty easy—just hit download! The file will save as a CSV or PDF file. Select CSV if you want to edit it in Excel.

And that’s it! There are other really cool tools (like maps!) on data.census.gov, so take your time and play around with it.
Not only can you learn facts about your community, but Census data is the starting point to answer other questions: What percentage of adults voted Republican in my town? How does my income compare to the median in my state? How has immigration in my county changed overtime? What are the most common occupations in the U.S.? These are all questions you need Census data to answer. Now, armed with the baseline population and demographic info, the options are limitless!
Enjoy, and always, let me know if you have any questions. TGIF!